

- SPY Daily chart shows price testing 20 Day SMA. This zone with 20 and 50 Day SMA may act as stiff resistance level.
- Bulls are showing a Daily MACD Bullish cross. Recent bullish crosses has done well for bulls as shown in 2nd chart.
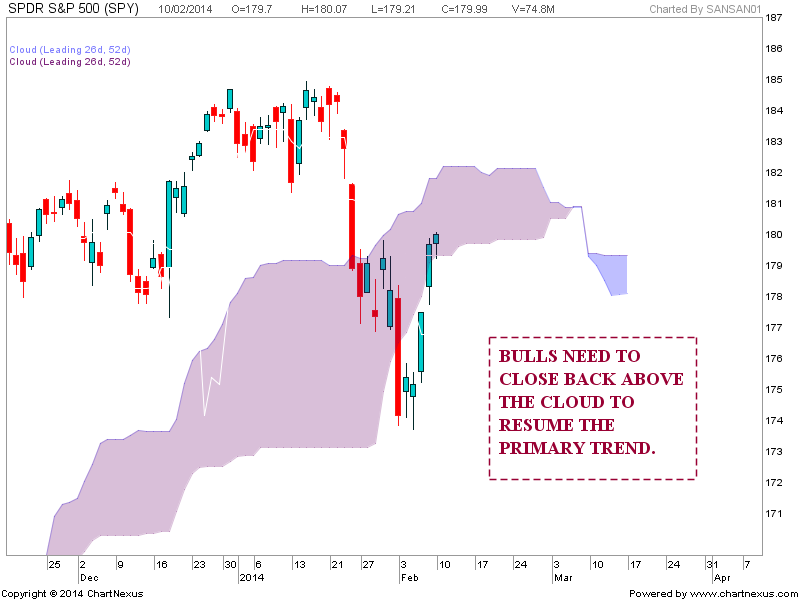
- Last chart shows price reentering the cloud. Bulls need to break back above the cloud to resume the primary trend.
- GOLD Near Resistance levels
No comments:
Post a Comment