


- ES Higher time frames are showing price at a crucial support resistance zone.
- Hourly charts are showing a nice trending move favoring bulls, That may end if the daily TF Fails to make a bullish close above 50 Day SMA. First chart also shows price testing a crucial support resistance zone.
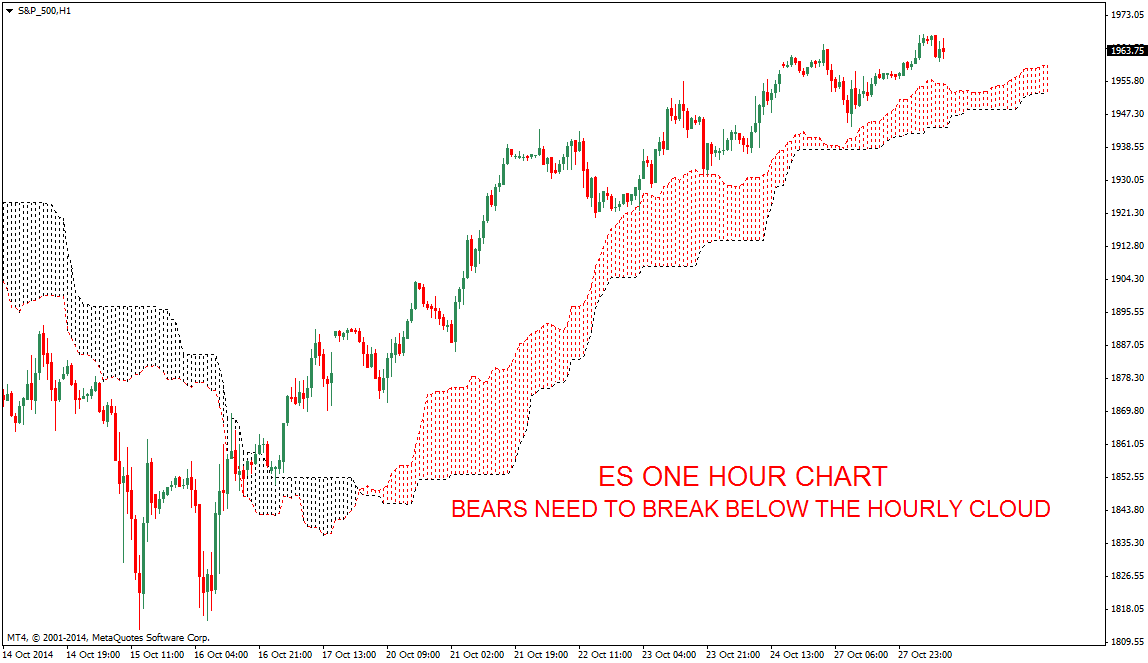
- For the very short term price must stay above the Hourly cloud for bulls to extend this up move.
- EURUSD Trend Update
No comments:
Post a Comment